
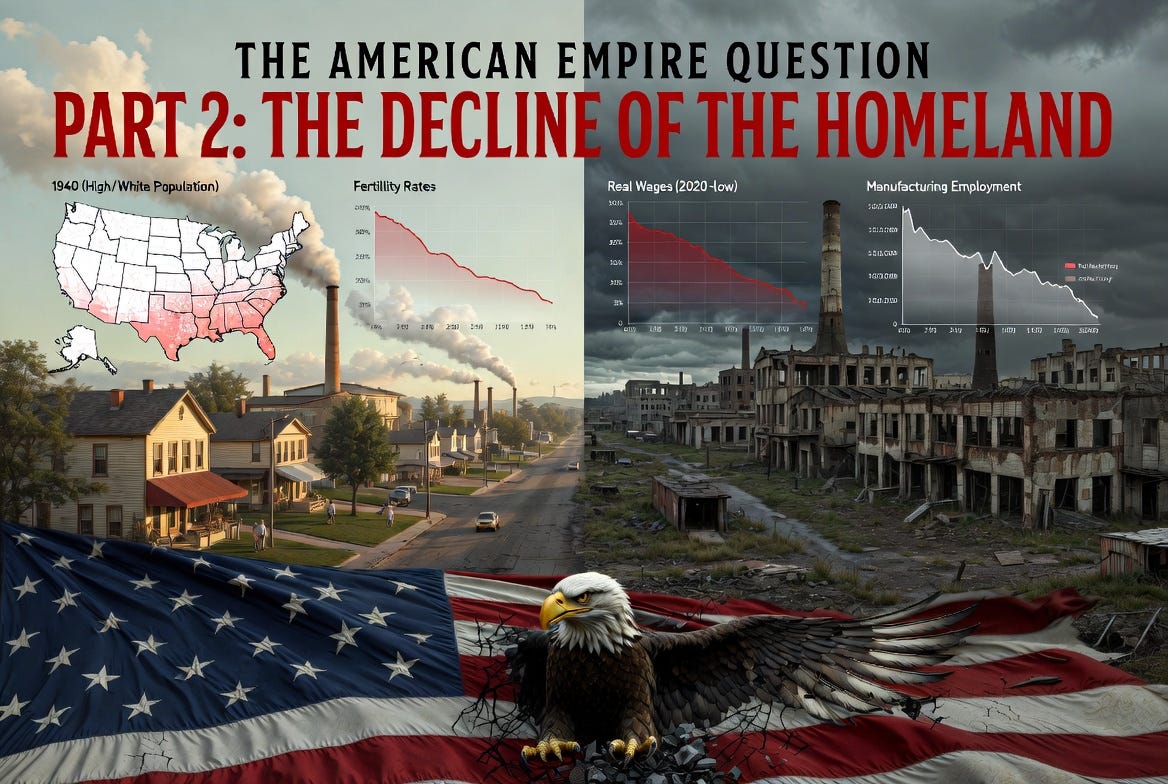
The American Empire Question - Part 2
Part 2 - The Decline of the Homeland


If you miss Part 1, read it here.
1. What good is your empire when it led you to this?
I want to use this article to establish some data concepts for the reader to keep in the back of their mind for the remainder of the series as we get into the weeds of how the American Empire operates and who it serves. For clarity, the common understanding of the beginning of the American Empire period is in 1945 in the immediate aftermath of the Second World War.
An important side note is that much of the following data is likely actually much worse (from the standpoint of White Americans) here in the year 2026 at the time of this writing. I chose to use data that cannot be argued against, which often requires going back to the 2020 census in many cases, or looking back at studies from several years ago that I thought were particularly relevant. None of these trends have improved over the past 5-6 years. When you feel compelled to support the foreign policy and various aspects of global domination that is advanced by our political and corporate leadership, keep in mind that these are their results in the only place that actually matters – the American homeland.
Material abundance was real for a time, more real than anywhere else at any time in history, but it always contained within it the seeds of its own destruction.
2. Demographic change
The percentage of the White population in America has dramatically decreased, going from a high of 89.8% prior to the start of WWII (the highest level that had ever been present in the US) to 61.6% per the 2020 census. Recent trends have even shown a reduction in raw numbers of the White population for the first time in the history of the US, falling from a total of 223,553,265 according to the 2010 US census to 204,277,273 in the 2020 census (see Figure 1.). In my view, this is the most damning data of all, especially given the fact that the US is governed by a democratic system. The ability for the descendants of the very people who founded the US to achieve a majority representation is diminishing. Figures 2, 3 and 4 show maps of the US with white percentages at a county level for 1940, 1980, and 2020 respectively.
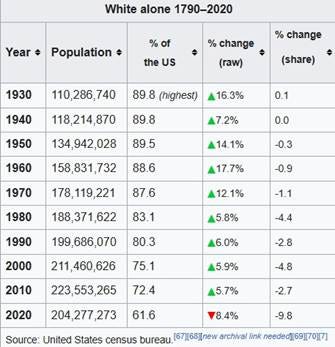
Figure 1. White alone population numbers and percentages, 1930-2020

Figure 2. White percentage of population at a county level, 1940

Figure 3. White percentage of population at a county level, 1980

Figure 4. White percentage of population at a county level, 2020
3. Fertility collapse
The fertility rate experienced a huge boom in the immediate aftermath of WWII, thus producing the baby boom generation, but since then we have been experiencing a severe decline beginning around 1960. The national fertility rate in 1945 was 2.42, rose to 3.58 by 1960, and has since reached a level of 1.78 as of 2020 (see Figure 5). To make matters worse, the fertility rate among White women had long been less than that of the various minority groups. Recently there has been some data that indicates groups like Asians and blacks have experienced their own plunging fertility rates that outpaced those of White women, but this is simply a slowing of the divergence between groups that had previously been growing. The White fertility rate itself remains just as low as it ever has been, which feeds into some specific trends, the most alarming of which can be found in two examples:
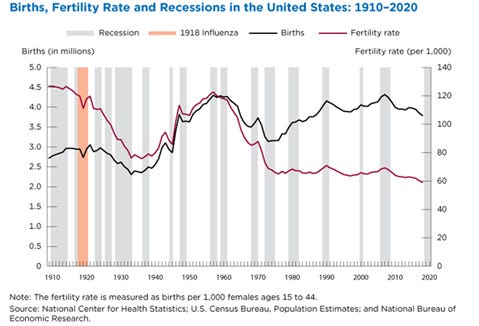
Figure 5. Fertility rate trends in US, 1910-2020
3.1. First, starting in 2016, the ratio of white births to white deaths fell below 1.0, which means every year the total white population shrinks (see Figure 6). This is the driving factor seen between the raw population numbers between the 2010 and 2020 census.
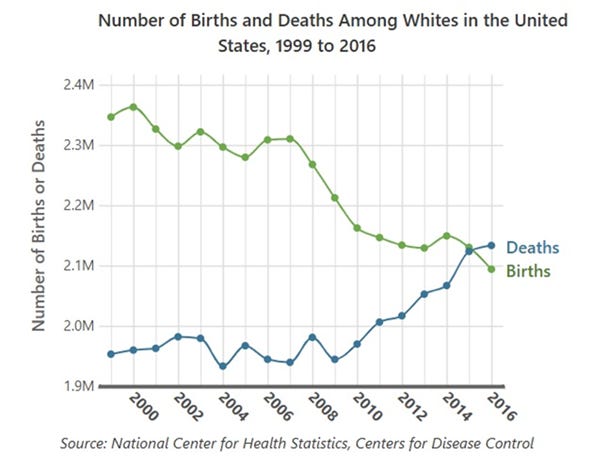
Figure 6. Number of births vs number of deaths for the US White population, 2000-2016
3.2. Second, the percentage of White births among the total births in the US fell below 50% in the period between 2016 and 2024. According to the study “Trends in US Live Births by Race and Ethnicity, 2016-2024”, the percentage of White births in the US fell from 52.6% in 2016 to 49.5% in 2024 (see Figure 7.).
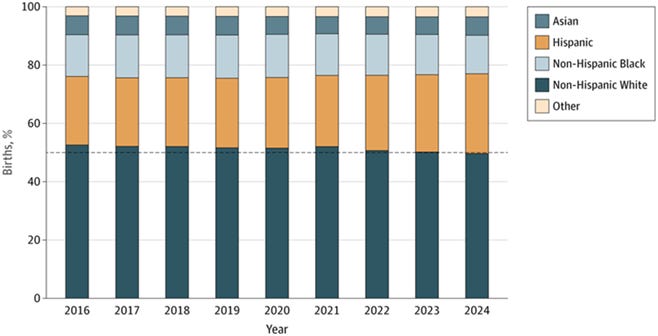
Figure 7. Percentage of births by ethnicity, 2016-2024
When people talk about the demographics being “baked in”, this is what they are referring to. We have already crossed the event horizon, and these trends are not reversible. At the time of this writing, there is also the looming Supreme Court decision on the status of birthright citizenship, with most feeling that the court will rule against the Trump administration. If the court rules the way that is expected, this birth data will likely forecast the composition of the next generation of citizens. This will happen even if immigration is completely stopped and if every single illegal immigrant is deported, pending the expected outcome from the Supreme Court case.
4. Economic destruction of the White middle class
Economic data would seem to be the most defensible position to justify the Global American Empire, and yet the devil is in the details there as well. Real wages in the US (purchasing power) have remained largely stagnant since 1979 (see Figure 8), with asset values exploding.
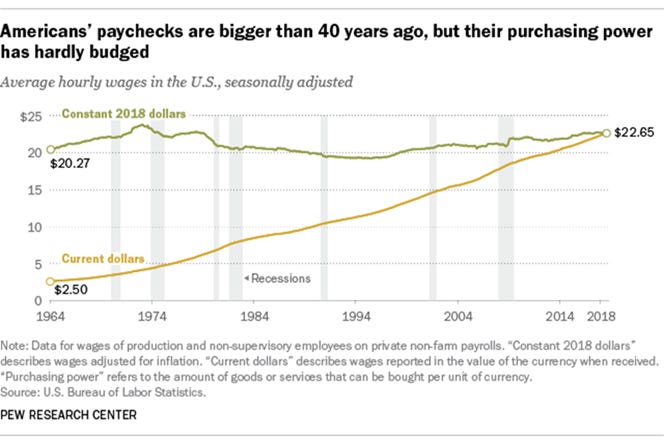
Figure 8. Wages vs purchasing power, 1964-2018
This has factored into a number of outcomes that are red flags for societal trends and health, such as shrinking middle class (see Figure 9) and a steady decline in male labor participation (see Figure 10).
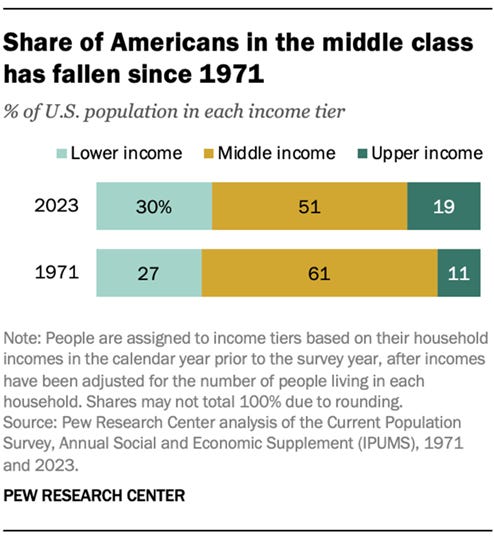
Figure 9. Percentage of Americans by class, 1971 vs 2023
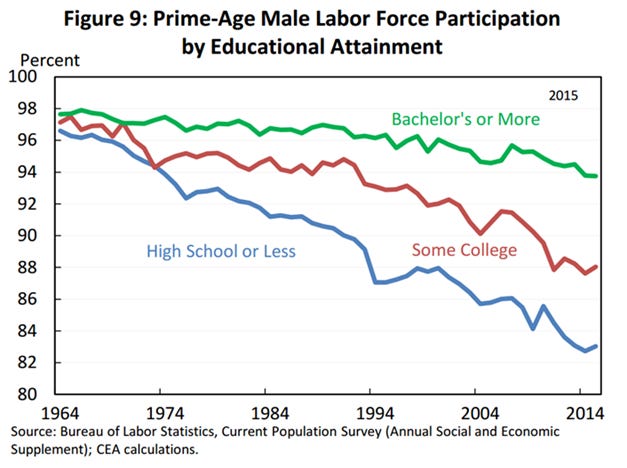
Figure 10. Prime-age male participation rates, 1964-2014
There is a section from the Unemployment in the United States Wikipedia article that I will share that was particularly enlightening for the current situation, with the key phrase below in bold:
Employment trends can be analyzed by any number of demographic factors individually or in combination, such as age, gender, educational attainment, and race. A major trend underlying the analysis of employment numbers is the aging of the white workforce, which is roughly 70% of the employment total by race as of November 2016. For example, the prime working age (25–54) white population declined by 4.8 million between December 2007 and November 2016, roughly 5%, while non-white populations are increasing. This is a major reason why non-white and foreign-born workers are increasing their share of the employed. However, white prime-age workers have also had larger declines in labor force participation than some non-white groups, for reasons not entirely clear. Such changes may have important political implications.
Our political class recognizes the tinderbox they have created.
5. Decline of manufacturing capacity and the death of rural America
In the wake of the Second World War, the US experienced an unprecedented boom in manufacturing capacity, which was largely a continuation of the momentum from the war production itself. In the aftermath of the war, the US found itself the only large power with its homeland virtually untouched from the damages of the war and thus had almost no competition in producing the majority of the world’s goods. This period (1950s and 1960s) was arguably the peak of American prosperity and quality of life, but the fruits of this success would bear the seeds that lead to the very thing that would be its ruin in the coming decades.
Manufacturing peaked in 1979, and since then has been in a state of steady decline. There are a number of things that have led to this, namely the 1973 oil crisis, the rise of Japanese and German manufacturing capacity (ironically a creation of US foreign policy), and then the rapprochement with China through the Nixon administration, leading to the enormous trade relationships we share to this day. All of these policies were deliberate US actions that were made to balance outcomes with its global priorities, but it seems clear that these decisions were made with little consideration on domestic impacts.
Manufacturing is the key for stability in rural America. In the peak of the American manufacturing boom, small towns and regions across the American heartland became specialty centers for certain types of manufactured goods. Since the end of World War II, the percentage of Americans employed by manufacturing jobs has dropped from around 35% to around 8% (see Figure 11). This decline as been particularly acute in the region known as the Rust Belt (the industrial upper Midwest), which had long been the industrial heart of the US, supplying key resources such as steel and coal. Figure 12 shows the specific decline in manufacturing employment experienced in the Rust Belt states since 1970.
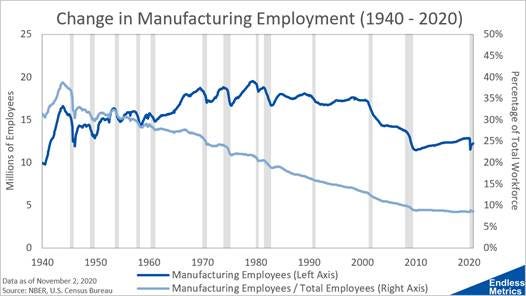
Figure 11. Decline of manufacturing employment percentage, 1940-2020

Figure 12. Manufacturing decline in key rust belt states, 1970-2014
One of the most tragic consequences of the manufacturing decline is the death of small towns across America. After the industrial revolution, most Americans transitioned from small agricultural communities and collected both in large cities as well as smaller cities scattered across the country. For someone whose family had been in America for many generations, perhaps they had to move away from the traditional family farm, but they were able to stay in the same general region of the country as their ancestors. This allowed the maintenance of likely the most important cohesive element to be found in America - small communities. It cannot be overstated how destructive this particular element of American decline has been to the general culture and cohesion of its population. A particular jarring study “Depopulation, Deaths, Diversity, and Deprivation: The 4Ds of Rural Population Change” goes into depth on this matter. For a simple visual that represents the scale of this change, see Figure 13 which details the population change between the 2010 and 2020 census, the first decrease in raw population numbers of rural areas seen in American history.
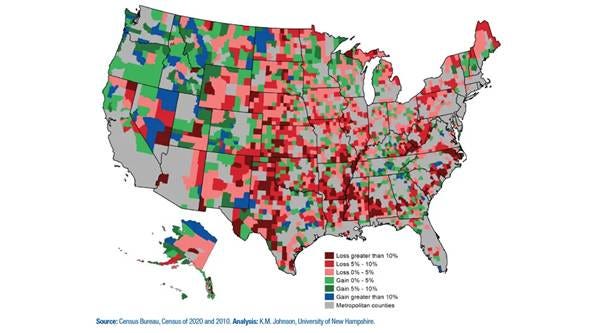
Figure 13. Decline in rural population, 2010-2020
These are not abstract statistics. They represent the unraveling of the physical, cultural, and economic world that allowed White Americans to thrive for generations.
Parting Thoughts
Any reader who has made their way to this corner of substack likely already has at least a low level understanding of all of these points raised in this article, but I feel like for most they keep these thoughts in a box and rarely examine them. Why did all of this happen? Why was it allowed to happen? And, in my opinion, the most relevant question: why are we willingly filling our role as just the newest generation managing an operation that produces these outcomes?
In the next article, I will go into detail on a case study of a specific pillar of the overseas American Empire and the subtle mechanics that keep it functioning - mechanisms most Americans have never been taught. It seems in large part, the core group performs the dirty work that keeps the Empire rolling and gives it its moral legitimacy is the group that understands it the very least, which is of course a feature, not a bug.
Liberals have long posed the tired rhetorical exercise of “if you could kill baby Hitler, would you?”. These old tropes have become increasingly exhausted by the contradictions surrounding us in the modern West, but at least there is still an element of truth to that phrase. They have killed baby Hitler, over and over again. There are forgotten men throughout the past 80 years who had their movements suffocated in the crib. Movements that warned against these kinds of results. The liberals all along believed what they said and acted on their beliefs. There is moral weight to the saying because it functions as a real ideological test that many of them must pass in their real lives. Meanwhile the conservative took in baby Trotsky as a foster child, and not only did they not kill him, but they kept a roof over his head and gave him an allowance. They continued to bail him out at the county jail, and pay his bills that were past due. They continue to be his benefactor to this day, as he sits in his apartment, in a decaying crime-ridden part of town, immobile from his obesity.
 | A guest post by
|
You should build a smokestack in the suburb, it would look cool.